ECOO '15 R3 P2 - Tiling Trouble
View as PDFA grid is subdivided into right-angled triangles with an arbitrary base (horizontal) and height (vertical). In the images below, the base of each triangle is and the height is
. Each triangular tile is made of a special color-changing material. By "reversing the polarity" of a tile you can trigger a color change.
Given a starting point (the and
coordinate of the right angle of a tile) and measurements in the horizontal and vertical directions, larger shapes can be specified. You can make right-angled triangles and rectangles in this way.
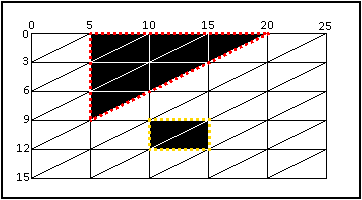
The diagram to the right shows a right-angled triangle at point with base and height of
tiles, and a rectangle at point
with a base and a height of
tile. Note the shaded tiles that are completely covered by the shapes.
If we reverse the polarity on those tiles we will change the color.
As we continue to define shapes we will continue to reverse the polarity on all tiles that lie completely within the shapes, and we will change their colors.
The input will contain test cases.
The first line of each test case consists of two integers and
that specify the base and height of the right-angled triangle tiles on the plane.
lies on the X axis while
lies on the Y axis.
The second line of the test case is the sequence of colors (e.g.m Red, Blue, SunshineYellow, etc.). The sequence will contain between and
colors. Each color is a single word and the colors are each separated by a single space. Each tile starts with the first color and changes to the next color in the sequence each time its polarity is reversed. If this happens enough times, the color sequence will restart from the beginning. Each color in the list will be different from the color immediately preceding it. Tiles share their edges, so reversing the polarity of either tile along an edge changes the color of the points on the edge.
The third line of each test case is an integer
, that specifies the number of shapes you will use for reversing the polarity of the tiles. The next
lines will each consist of a shape described in one of the two following ways:
T X Y Tb= Triangle with the right angle at pointand a base of
tiles, where
and
R X Y W H= Rectangle with a corner at pointtiles and a height of
tiles, where
The last lines of a test case will each consist of two integers
and
representing a point on the grid.
For each unique color in the sequence, you must output the number of points that will end up that color after the appropriate tiles have had their polarities reversed once for each of the shapes in the list. The colors and counts should be printed on a single line using the exact format shown below. The order in which you output the colors on each line is not important.
Note that in the sample input, there are test cases, each with
points but the real data will have
test cases with
points each.
Sample Input
1 3
White Black
10
R 78 66 19 2
T 18 96 8
T 2 78 1
R 87 78 66 2
R 33 45 55 11
R 50 36 8 3
T 59 72 40
R 19 15 67 6
T 51 54 17
R 98 54 16 28
123 60
33 64
196 177
99 145
88 162
3 3
White Black
10
R 45 63 8 23
R 42 18 19 21
R 45 42 28 30
R 18 48 19 12
R 3 63 22 4
T 75 72 28
T 84 72 22
T 42 0 22
T 78 57 29
R 24 36 25 6
108 44
24 164
177 40
122 82
115 37
3 2
White Black
10
T 75 44 27
R 12 36 6 26
T 21 12 4
T 3 38 22
T 45 40 17
T 75 32 30
T 33 80 1
R 6 42 19 49
T 15 92 24
R 72 66 5 16
172 120
195 82
61 99
140 169
132 155
Sample Output
Black:1 White:4
Black:1 White:4
Black:0 White:5
Educational Computing Organization of Ontario - statements, test data and other materials can be found at ecoocs.org
Comments