Cosmic Inflation
View as PDFECOO Practice 2014
A recent discovery in the field of astrophysics dealing with the BICEP2
(Background Imaging of Cosmic Extragalactic Polarization) and Keck Array
experiments has produced amazing evidence to support the theory of
cosmic inflation! Inflation refers to the rapid expansion of the
universe at a rate much faster than the speed of light, lasting from
seconds to sometime between
and
seconds after the Big Bang. During this incredibly
short period, the volume of the universe was increased by a factor of at
least
. This discovery is a huge step in the direction of
confirming the Big Bang theory.
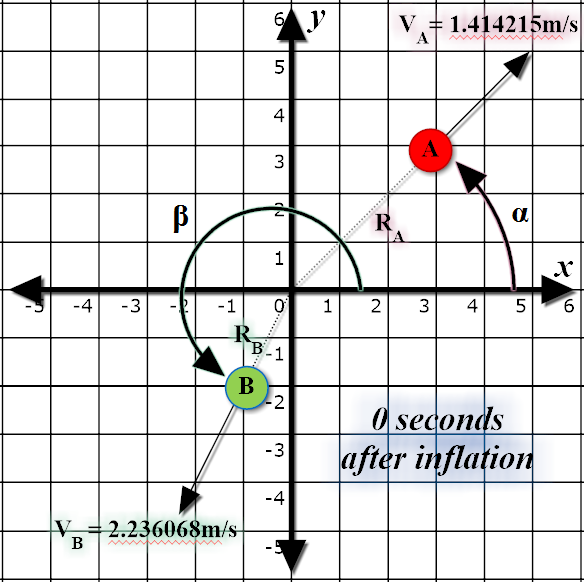
Part of the evidence for the Big Bang theory is the observation that planets and particles in the universe are constantly moving apart from each other. The first particles of the universe (including W and Z bosons and Higgs bosons) formed at the end of the inflationary period and were dispersed throughout the universe. Your task is to model the simple dispersion of two such particles from the singularity at the beginning of the Big Bang.
For simplicity's sake, we will work in 2 dimensions only for this
problem. Let us label our particles A and B, and set the "centre" of the
universe (where the singularity of the Big Bang is originally
concentrated) as the origin of a Cartesian plane, the point .
Inflation has already propelled the two particles
and
metres, respectively, away from the centre. The particles, after being
accelerated, are now moving at a constant velocity of
and
away from the centre. The directions in which
particles A and B are moving are, respectively,
degrees and
degrees
counterclockwise relative to the positive
direction. Given this
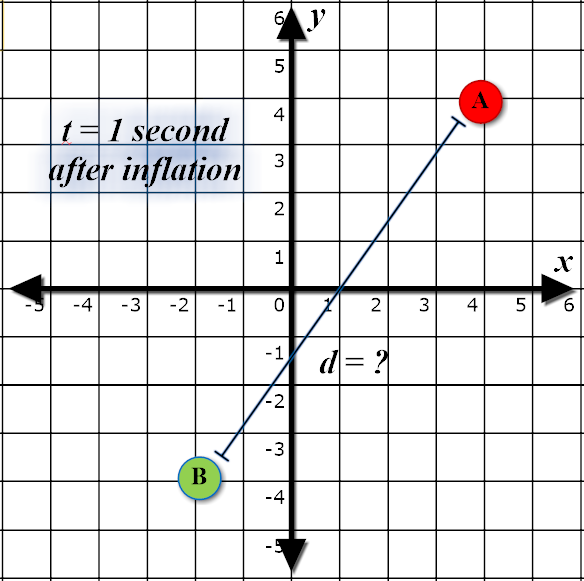
information, what is the distance between the particles
seconds
after inflation has ended?
Input Specification
The input will contain 10 test cases. Each test case will consist of a
single line with 7 space separated real values, in the order: ,
,
,
,
,
, and
. It is guaranteed that all
values in the input will be less than
in magnitude, and that the
paths of A and B will never overlap.
Output Specification
For each test case, output a single real value, rounded and displayed to
exactly 2 decimal places. The distance the particles are from each other
after seconds has elapsed.
Sample Input (Only 5 examples shown here)
4.242641 2.236068 1.414215 2.236068 45 243.43495 1
100.0 100.0 10.0 10.0 135.0 315.0 100.0
101.99 607.37 16.69 16.54 329.17 317.29 6061.14
162.92 380.26 6.71 5.49 227.61 69.98 3203.42
815.85 681.36 3.61 9.48 207.39 47.93 1540.80
Sample Output
10.00
2200.00
20920.74
38878.86
21378.26
Explanation
The following diagrams depict the first test case in the sample input.
Comments